Let’s suppose we have some data for height and weight of some adult humans. We suspect the weight depends on the height – so taller people tend to weigh more than shorter. How can we develop this theory and use it to predict someone’s weight based on their height? Here’s a short introduction.
AT GCSE: draw a scatter diagram with height on the x-axis and weight on the y-axis (because we think height is affecting weight rather than the other way round). Now comes the tricky bit: adding our line of best fit to run as closely as we can get it to the crosses. Use a transparent ruler and place it at what you think is the best gradient (“steepness”). Now slide the ruler, keeping its gradient fixed, until there are the same number of crosses on each side. Now you can draw your line of best fit: voilà! In practice this is actually a lot harder than it sounds! And so:
AT A-LEVEL: we now refer to the “line of best fit” as the regression line. Why? Because it’s quicker to say and write: two words instead of four! The x-axis-variable is called the predictor or independent variable, and on the y-axis goes our outcome or dependent variable. And rather than having to guess where the line should go by eye, we develop a mathematical process for figuring exactly where the regression line should go.
Why not try this out right now?
On the Casio fx-991 (standard A-level Classwiz calculator) it’s menu 6 option 2. Enter your data (or just make some up), then press OPTION and 3 for the equation of your regression line.
Microsoft Excel can also add trendlines: highlight your data, insert graph (choose “scatter”), press the + sign beside the graph, and ask for a trendline.
We can even fit a curve of best fit! (“non-linear regression“). The process is slightly different depending on whether we would like a polynomial fit (like $y=x^2$) or an exponential fit (like $y=ab^x$) but both use some clever trickery with logarithms to transform our curved relationship to a straight line one. This time it’s menu 6, scroll down to the next screen, then its option 2 (exponential) or 3 (polynomial).
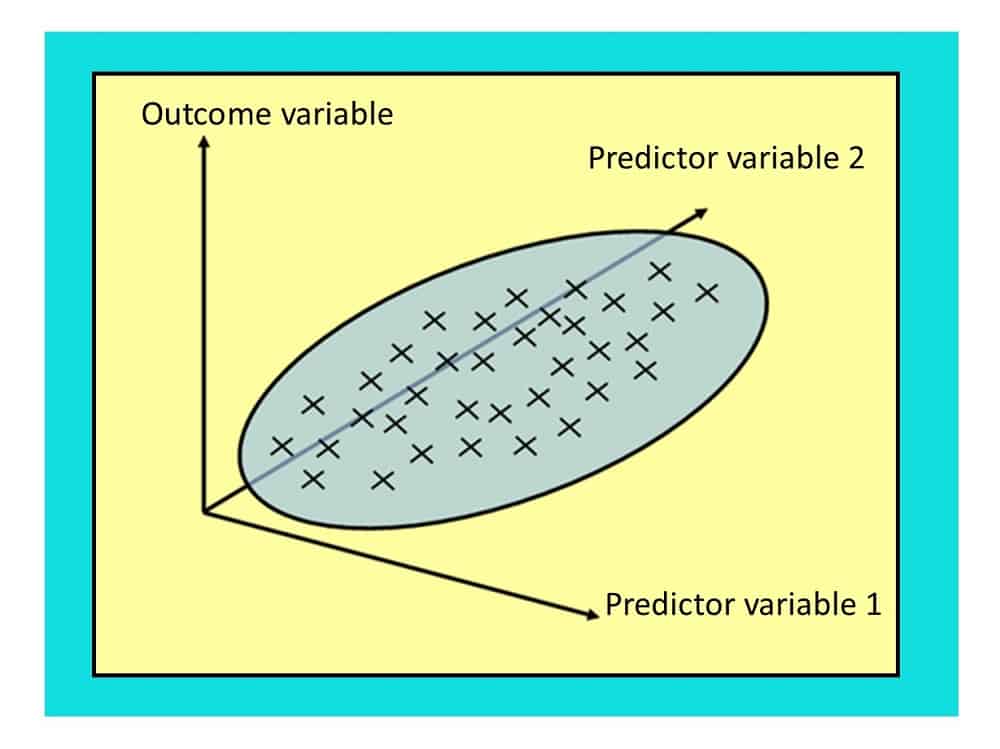
BEYOND A-LEVEL: what if we think weight also depends on a second predictor variable, such as “quality of diet” (which we would have to figure out a way to measure). Then instead of a line of best fit in 2 dimensions, we need a plane of best fit in 3 dimensions! We’re now in the realms of multiple regression (more than one predictor variable). The equation of the plane will be something like $y=\beta_0 + \beta_1x_1 + \beta_2x_2$ where $x_1, x_2$ are the variables height and diet, and the betas are the regression coefficients that describe how we think each variable might be influencing the weight.
Why stop there? You can have as many predictor variables as you like (although we can no longer draw a scatter diagram as in this reality we are constrained to a mere 3 dimensions!). Why not add exercise and gender into the mix? (Gender might be coded as 0=male or 1=female). We can then obtain a much better prediction of someone’s weight based on their height, diet, exercise and gender.