An average is simply a way of picking out a typical value from a set of objects (usually numbers). There are infinitely many different ways to pick a “typical value”, but here are some of my favourites:
Midrange average:
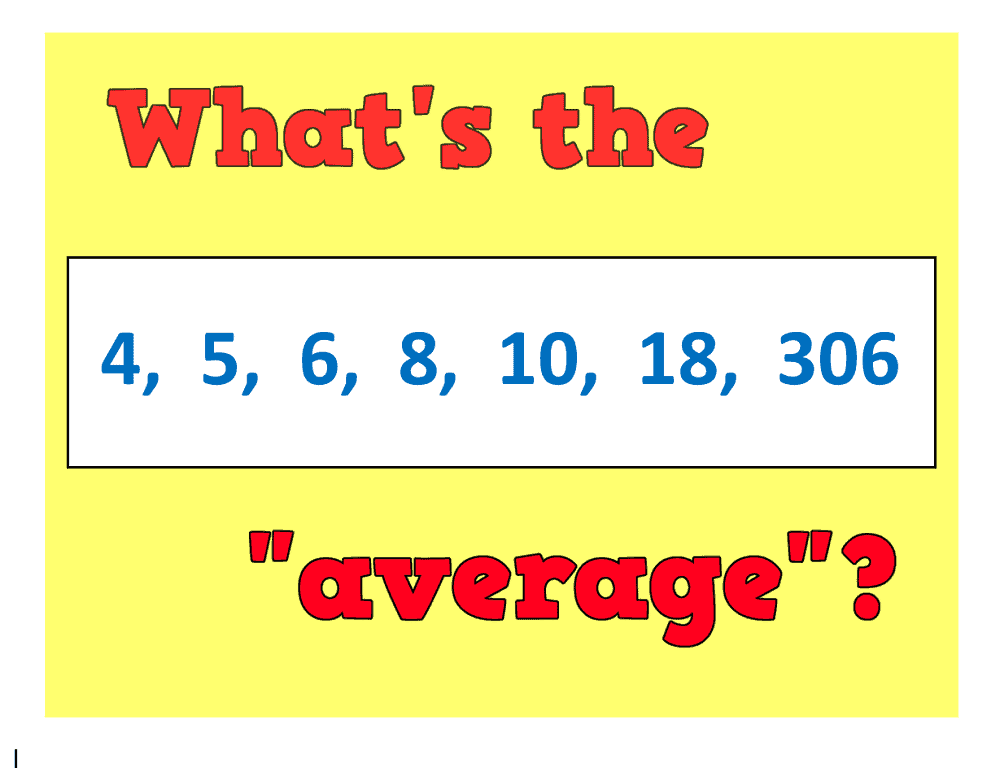
The simplest of the lot: just calculate the number that is half way between the smallest and largest value. The midrange of the data set pictured is 155 (half way between 4 and 306).
Using the midrange, you can truthfully tell your parents that you did “better than average” in the maths exam, even if you were the second worst in the class! All you need is for a single person to have dropped more than twice the marks that you did.
Got to love that!
Mean average:
The Arithmetic Mean (to use its full name) is the average people usually “mean” when they think of the average.
AT GCSE (Foundation): add the numbers up and divide by how many there are.
AT GCSE (Higher): mean = sum of values ÷ number of values.
AT A-LEVEL AND BEYOND: we introduce the symbol $\bar{x}$ pronounced “x bar” for the mean:
$\bar{x} = \dfrac{\Sigma x}{n}$ or for grouped data $\dfrac{\Sigma fx}{\Sigma f}$
Unfortunately, the data set pictured has an outlier or “extreme value”: the data point 306 pulls the mean up to 51, which most of us would agree is too big to be a sensible “typical value”.
Geometric Mean average:
If we can add them up and divide by $n$, why not multiply them all and take the $n$th root? This mean would be $\sqrt[7]{4 \times 5 \times 6 \times 8 \times 10 \times 18 \times 306} = 12.68…$
Why would you want to do that??
This average allows you to find the average interest rate of the money in your bank account:
e.g. Suppose your money grows at 3%, 6%, 8% in year 1, 2, 3. What interest rate, fixed over the whole 3 years, would this be the same as?
Simply find the geometric mean of the three multipliers. The multipliers for 3%, 6%, 8% interest are 1.03, 1.06 and 1.08 (check your GCSE maths to find out why this is). The geometric mean is
$\sqrt[3]{1.03 \times 1.06 \times 1.08} = 1.0564…$ so the result is the same as if the bank had paid us a fixed rate of just over 5.6% each year.
Median average:
Put them in order and choose the middle one. In our case: 8.
Notice that using the median does not suffer from the same problem as the mean: the outlier 306 does not distort it. For this reason the median is usually preferred if your data set has outliers or is skewed (lopsided rather than symmetrical).
In 2020 the average income for adults in full time employment in the UK was about £26000 using median but £32000 using the mean – quite a difference!
AT A-LEVEL: we introduce the symbol $Q_2$ for the median, because it is the second quartile (or two quarters of the way through the data).
Mode average:
AT GCSE: “the one that appears the most”.
AT A-LEVEL: the value with the highest frequency.
Our data set does not have a mode, since each value appears just once. Some data sets have several modes e.g. 4, 5, 5, 6, 8, 8 (the two modes are 5 and 8).
This average is most useful for qualitatative (non-numerical) data such as eye colour or favourite Harry Potter character.
Harmonic Mean average:
Yes, it’s another type of mean!
This time you take the reciprocal of the arithmetic mean of the reciprocals (!).
A REMINDER: the reciprocal of $x$ is $\dfrac{1}{x}$
Why would you want to do that??
If you make a journey at one speed going out, and a different speed on the return journey, then the Harmonic Mean gives you your average speed for the whole journey – pretty cool!
e.g. 60 mph outbound, 20 mph return, the time for the whole journey will be the same as travelling there and back at a speed of:
$\dfrac{1}{(\dfrac{1}{60} + \dfrac{1}{20}) \div 2}$ = 30mph
See if you can check this gives the same overall time (hint: time = dist ÷ speed)
A FINAL WORD:
No discussion of averages would be complete without the delightful rhyme (sing along if you know the tune…):
Hey Diddle Diddle
The Median‘s the Middle
You add and divide for the Mean.
The Mode is the one that appears the most
and the Range [not an average but a measure of spread!] is the difference between.