TARGET AUDIENCE: A-level statistics or A-level Further Maths.
A Real World example of a chi-squared test in action follows: this sort of test is extremely useful in a huge range of real-world scenarios!
At our board games club, my friend Peter claims that my dice isn’t fair, and prefers to use his (very expensive) “precision dice”. Peter reckons that most ordinary dice roll a 6 much more often than a 1 (the reason being that the 6 face has 6 small holes drilled out of it to represent the “pips”, whereas the 1 on the opposite face has just one small hole drilled out. The dice is therefore heavier on the 1 side, which will therefore be more likely to land face down, resulting in more 6’s than 1’s).
Surely this will only have a tiny effect on the outcome of the dice? I was intrigued and so rolled my dice a bunch of times. Here are my results, with the frequency (the “count”) of each outcome in brackets:
1(142); 2(95); 3(116); 4(125); 5(105); 6(185).
As you can see, the 6 was indeed rolled more often than the 1, as Peter predicted. It looks like the dice is indeed biased, but how do we know this isn’t just by chance – maybe running the experiment again would give different results, with a different number being rolled most frequently?
What we need here is a chi-squared goodness-of fit test!!
We start by writing our two hypotheses, which the test will help us to decide between:
NULL HYPOTHESIS: the data comes form a uniform discrete distribution. Discrete means the dice can only take particular values with gaps in between (1, 2, 3, 4, 5, 6) and uniform means the probabilities are all the same (they should each have probability 1/6 if the dice is fair).
ALTERNATIVE HYPOTHESIS: the data does not come form a uniform discrete.
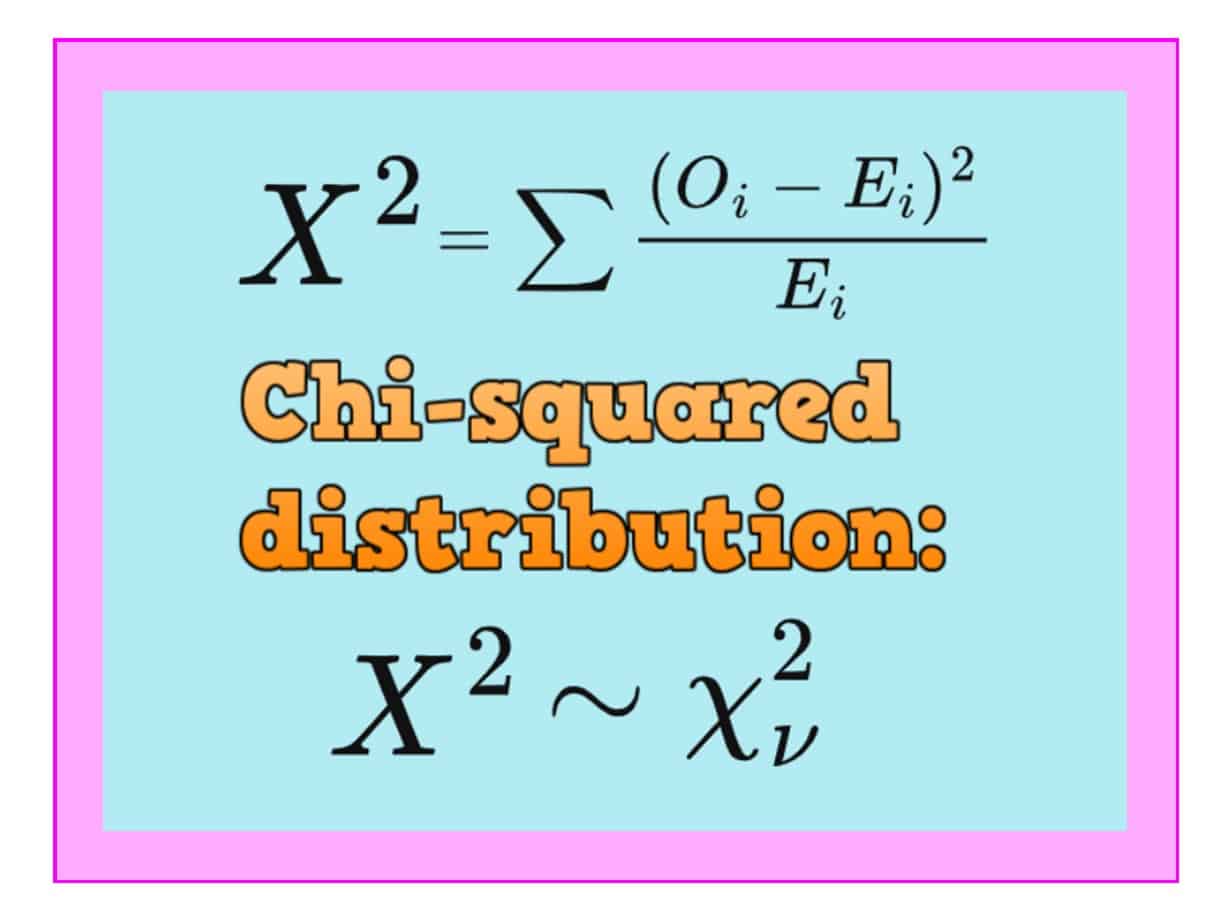
Now we calculate the test statistic $X^2 = \sum \frac{(O_i-E_i)^2}{E_i}$
The $E_i$ are the expected frequencies if the null were true: in this case I rolled the dice 768 times so I expect each outcome to be rolled 768÷6=128 times.
The $O_i$ are the Observed frequencies (142, 95, 116, 125, 105, 185).
This gives:
$X^2 = \frac{(142-128)^2}{128} + \frac{(95-128)^2}{128} + … + \frac{(185-128)^2}{128}$
= 1.53 + 8.51 + 1.13 + 0.07 + 4.13 + 25.38
= 40.75.
To complete the test, we compare this value 40.75 with a critical value taken from a table of critical chi-squared values:
$\Χ^2_{(0.99,5)}=15.09$
Here, the 0.99 says that we are using a 1% significance level (the probability I am prepared to tolerate that we would get such a lopsided set of frequencies by chance alone) and the 5 is our degrees of freedom (a measure that tells us which chi-squared distribution we should be using for this test). The degrees of freedom is very easy to work out for a Goodness Of Fit test as it’s the number of outcomes (in our case 6) subtract one:
$d.o.f. = 6-1 = 5$
Our observed value of 40.75 is much larger than our critical value of 15.09 so we reject the Null Hypothesis and conclude that the dice is indeed biased.
So how unlikely are we to have observed such a lot of sixes by chance alone?
Fortunately we can calculate that too! The p-value for this test – which I obtained from free statistical software R using syntax 1-pchisq(40.75,5) – is 0.00000001, so it could be down to luck that I rolled so many sixes and so few twos, but we would only expect to see such an extreme result 0.00001% of the time (!).
What now? the chi-square test has convinced me that my dice are no good, and so I have now invested in some (expensive) precision dice, as Peter suggested i should have done in the first place!
HOW DOES IT WORK?:
The test works by seeing how far away the Observed frequencies are from the Expected frequencies (the difference is squared to make sure it’s always positive) then expressing that as a fraction of what it should be. The test then compares the sum of all these terms (the Greek Σ means “sum of ” or “add them all up”) to a critical value (the “line in the sand” value which, if exceeded, indicates that our observed values are very unlikely to have occurred if the null hypothesis is true – the inference being that we should throw out the Null).
1 thought on “WHAT’S THE POINT OF CHI-SQUARED GOODNESS OF FIT TEST?”
Comments are closed.